· Greenback· U.S. Economy
Why the US Economy May Be Heading for a Recession by Late 2026
The US economy ended 2025 on shaky ground, and the early signals for 2026 aren't looking much better. While recession calls have come and gone over the past few years — often proving premature — the current convergence of weakening indicators across GDP, coincident activity measures, freight, and transportation-linked equities paints a picture that's harder to dismiss. Here's what the data is telling us, and why a recession by the second or third quarter of 2026 is a realistic scenario.
Growth Has Stalled
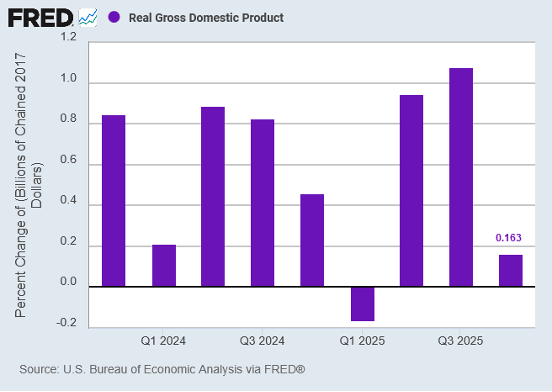
The headline number that should concern everyone: real GDP growth in Q4 2025 came in at just 0.16% quarter-over-quarter, which annualizes to less than 0.7%. That's not contraction — but it's uncomfortably close to the zero line, and it represents a sharp deceleration from the stronger growth the economy posted earlier in 2025.
What makes this especially notable is that the Bureau of Economic Analysis revised the Q4 figure down significantly from an initial estimate of around 1.4% annualized. The culprits behind the revision were weaker-than-expected consumer spending, softer government expenditures, and a smaller drag from imports than previously estimated. When growth gets cut in half on a revision, it suggests the underlying momentum was even weaker than forecasters initially believed.
An economy growing at sub-1% annualized rates has almost no buffer. Any additional shock — whether from trade policy, tightening financial conditions, or a pullback in business investment — could easily tip growth into negative territory.
The Coincident Index Is Flashing Yellow
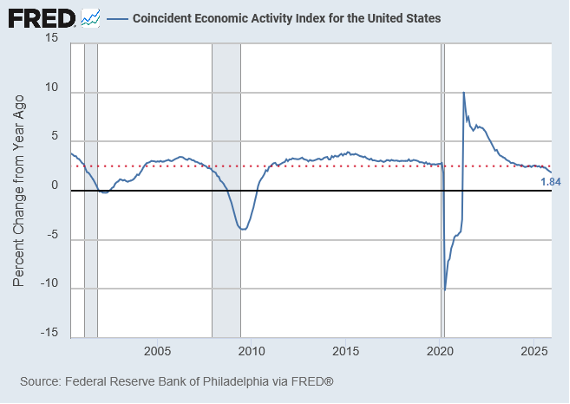
One of the more reliable recession indicators is the Philadelphia Fed's Coincident Economic Activity Index, which combines four state-level variables: nonfarm payrolls, average hours worked in manufacturing, the unemployment rate, and wage and salary disbursements. It's designed to capture the current state of economic activity in real time, rather than trying to predict the future.
By December 2025, year-over-year growth in this index had slowed to just 1.84%. Historically, readings below 2.5% on this measure have been closely associated with the lead-up to recessions. The index doesn't dip to these levels during garden-variety slowdowns — it tends to reach this territory only when the economy is approaching or entering a genuine downturn.
This matters because the coincident index isn't a sentiment survey or a financial market signal that can be distorted by speculation. It's rooted in hard labor market and income data, which makes its current weakness particularly meaningful.
Transportation and Freight Are Weakening
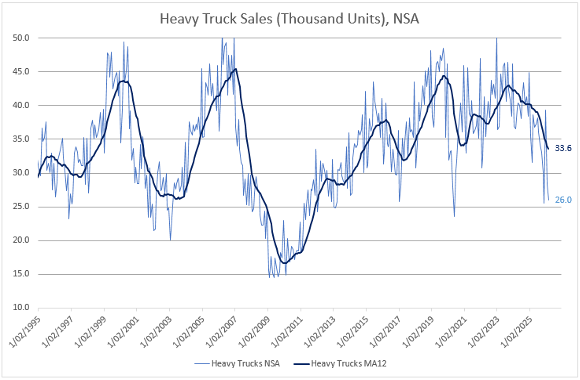
If GDP and the coincident index tell us where the economy is right now, transportation indicators offer a window into where businesses think it's headed. Heavy truck sales have been declining, with seasonally adjusted figures falling well below recent peaks. Businesses buy heavy trucks when they expect to move more goods; when orders fall, it signals that companies are anticipating less demand ahead.
The equity markets are echoing this concern. The S&P 1500 sub-indices for Containers & Packaging, Airfreight & Logistics, and Road & Rail all fell sharply in early 2026. These sectors are often considered economic bellwethers because they're directly tied to the physical movement of goods through the economy. When all three decline simultaneously, it's a strong signal that the industrial and logistics backbone of the economy is weakening.
This kind of synchronized decline across freight-sensitive sectors has historically preceded broader economic contractions. It suggests that the slowdown isn't confined to one corner of the economy — it's showing up across the supply chain.
How We Get to Recession by Q3
None of these indicators in isolation guarantees a recession. GDP could rebound in Q1 2026 on seasonal factors or a burst of inventory building. The labor market, while softening, hasn't collapsed. But the risk lies in how these signals reinforce each other.
Weak GDP growth means less room for error. A deteriorating coincident index means the current state of the economy is already fragile. Falling truck sales and transportation equities mean businesses are positioning for further weakness. If consumer spending — which has been the primary engine keeping growth positive — begins to falter under the weight of persistent inflation, high interest rates, and cooling job growth, the path to two consecutive quarters of negative GDP growth becomes uncomfortably plausible.
Trade policy uncertainty adds another layer of risk. Tariff escalation or supply chain disruptions could further weigh on business confidence and investment, accelerating the slowdown already in motion.
What to Watch
In the months ahead, the key indicators to monitor are monthly payroll reports, consumer spending data, and whether the coincident index continues its downward trend. If the labor market cracks — even modestly — it could trigger the negative feedback loop between employment, income, and spending that defines a recession.
The data doesn't lie, even if its timing is imperfect. Right now, it's pointing toward a US economy that is losing momentum fast, with a meaningful probability of recession by the second or third quarter of 2026. Whether policymakers can respond quickly enough to change that trajectory remains an open question.